The score combines four sub-scores. Each sub-score measures how far today’s value is from your own normal range. A sub-score of 50 means exactly your average. Above that you are better recovered than usual, below that worse.
Weighting
| Sub-score | Share | Higher is better when |
|---|---|---|
| HRV | 30 % | your HRV is above your average |
| Resting HR | 25 % | your resting heart rate is below your average |
| Load | 25 % | your training is in the sweet spot |
| Sleep | 20 % | you slept enough or longer than usual |
Categories
| Score | Category | What RunReady suggests |
|---|---|---|
| 85 to 100 | Ready | quality or long run |
| 65 to 84 | Good Day | normal training |
| 45 to 64 | Easy Day | easy training only |
| 25 to 44 | Recovery | light or active recovery |
| 0 to 24 | Rest Day | rest day |
If a sub-score is below 60, it limits the recommendation, and RunReady names it in the reason, for example “HRV below baseline, reduce intensity”.
HRV
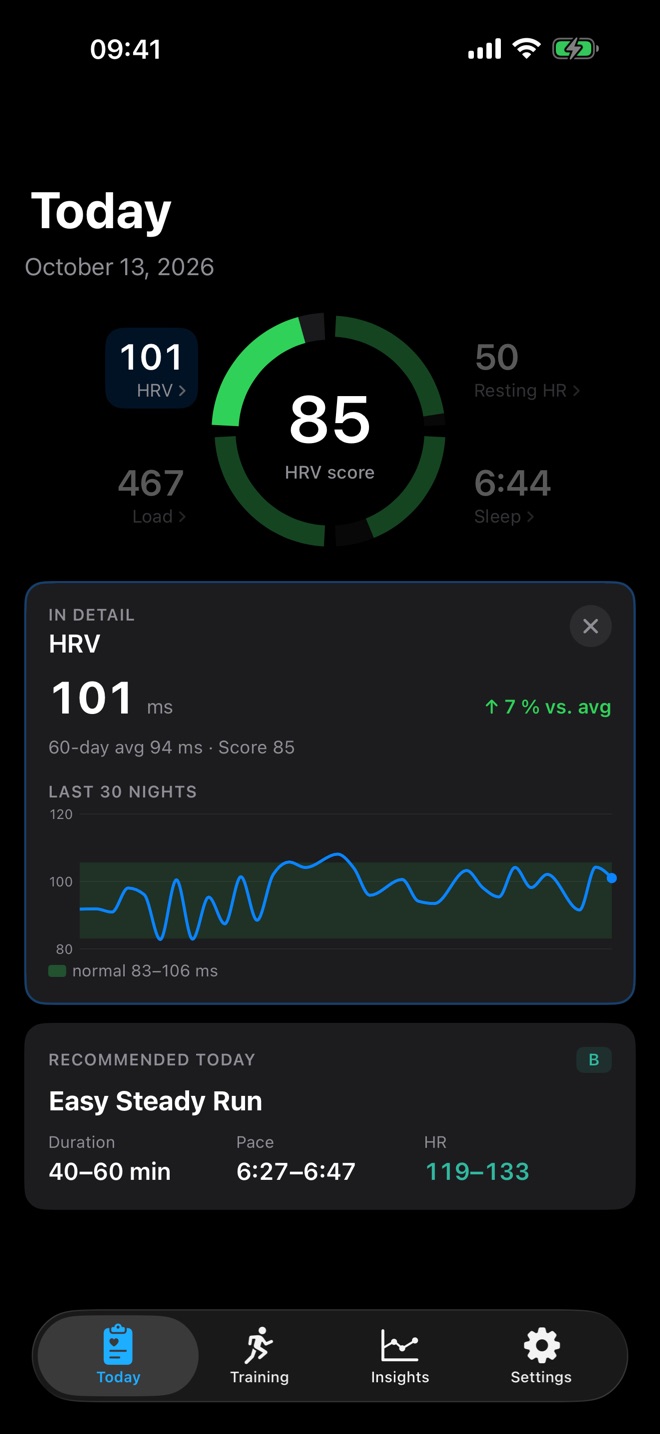
Heart rate variability (SDNN) shows how well your nervous system recovered overnight. RunReady compares the night with your average and your spread. So that a calm month does not inflate every small swing, the app uses a spread of at least 10 ms and at most 20 % of your average.
The detail view shows the night’s value with its deviation, your 60-day average and the last 30 nights. The green band is your normal range (average plus and minus one standard deviation); the legend gives it in milliseconds.
Resting heart rate during sleep
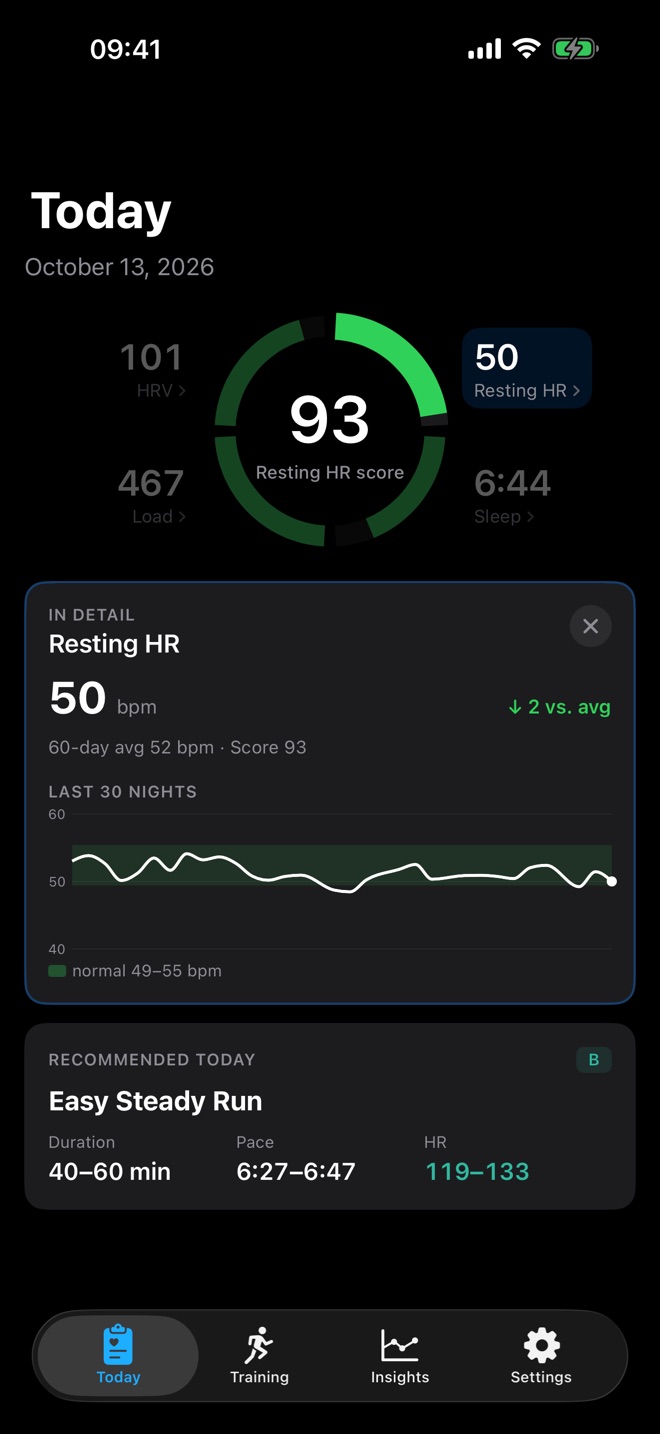
RunReady does not read Apple’s daily “Resting Heart Rate” but averages your heart rate while you sleep. The value is ready as soon as you wake up. A lower resting heart rate than usual raises the sub-score.
If your resting heart rate is more than 5 bpm above your average for two nights in a row, it turns red with a dot in the ring and the detail view shows a note. Older episodes are listed in the log under Settings › Notifications, where you can also turn on a notification for it.
Sleep
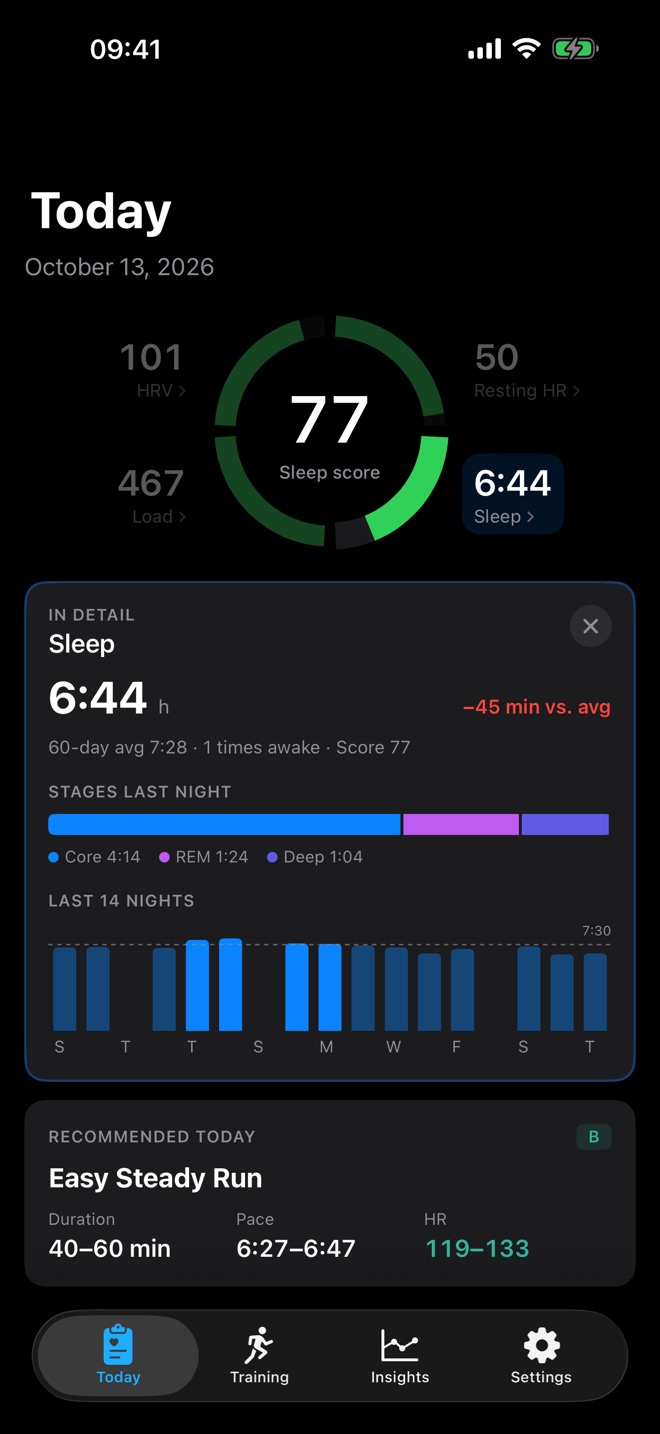
The sleep sub-score takes the better of two values: absolute (7.5 to 9 hours give 100) and relative to your average. If you usually sleep short, you are not penalised every day.
The detail view shows last night’s core, REM and deep stages, awake phases and the last 14 nights against a line at 7:30 h.
Several sleep apps: if AutoSleep, Pillow, Oura or Whoop also write sleep to Apple Health, RunReady takes one source per night, preferring Apple’s own sleep analysis, and counts overlapping minutes only once.
Load
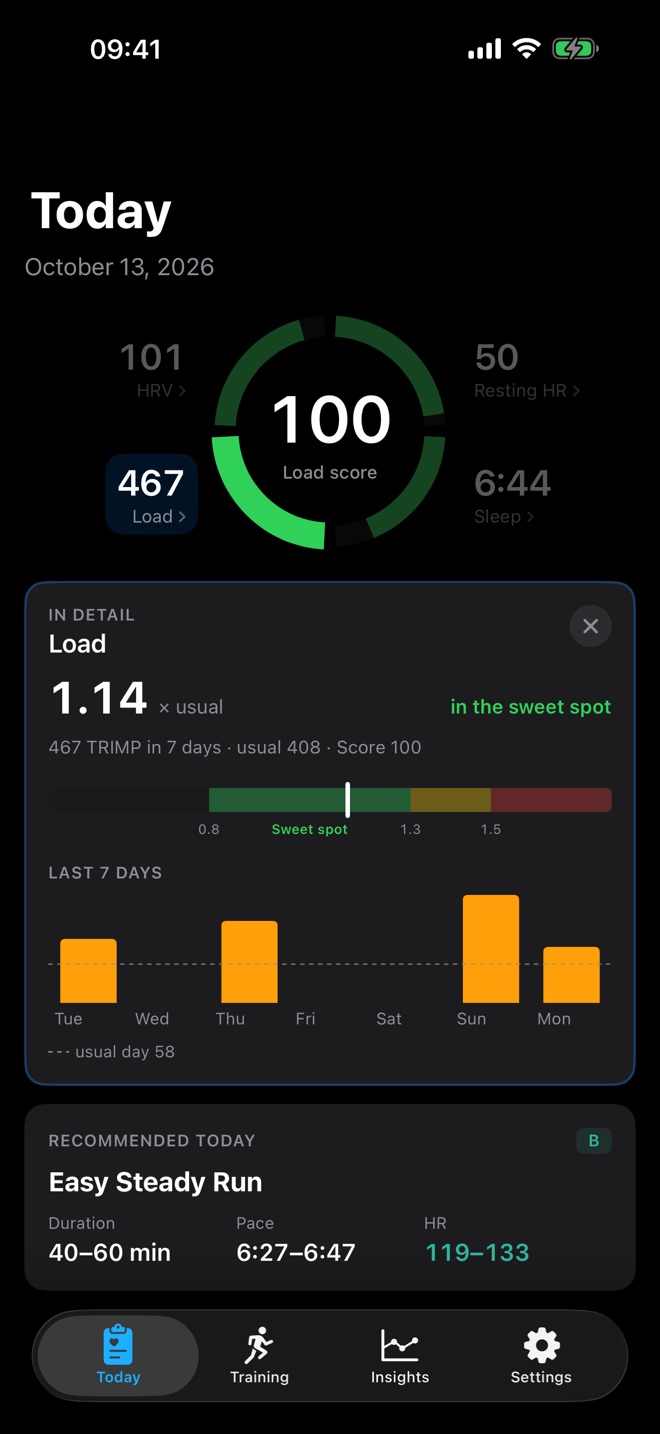
Load compares your last 7 days with your usual training of the last 60 days. It is based on TRIMP, a training load from the duration and heart rate of each run. The headline value is the ratio, for example 1.14 × usual.
| Ratio | Range | Sub-score |
|---|---|---|
| below 0.8 | below usual | 70 to 85 |
| 0.8 to 1.3 | sweet spot | 100 |
| 1.3 to 1.5 | above | 100 to 60 |
| above 1.5 | well above | below 60, falling steeply |
The chart shows the TRIMP values of the last 7 days against the dashed “usual day” line.
How reliable is the score?
The score measures deviations from yourself, not from a norm. It reliably shows clear swings, for example after a short night or at the start of a cold. Small fluctuations around 50 mean little. That is why RunReady asks how you feel before it shows the recommendation.
Question not answered?
Write to me from the app under Settings › Send Feedback. Version and device are already in the email.
Or email marvin.blome@gmail.comNot installed yet?
RunReady runs on iPhone with Apple Watch. No subscription, no account.
Get RunReady